Website Case Study
Live Oil Price
Live crude and natural gas prices on our own site, with the inventories, rig counts and production data behind them set out underneath.
At a Glance
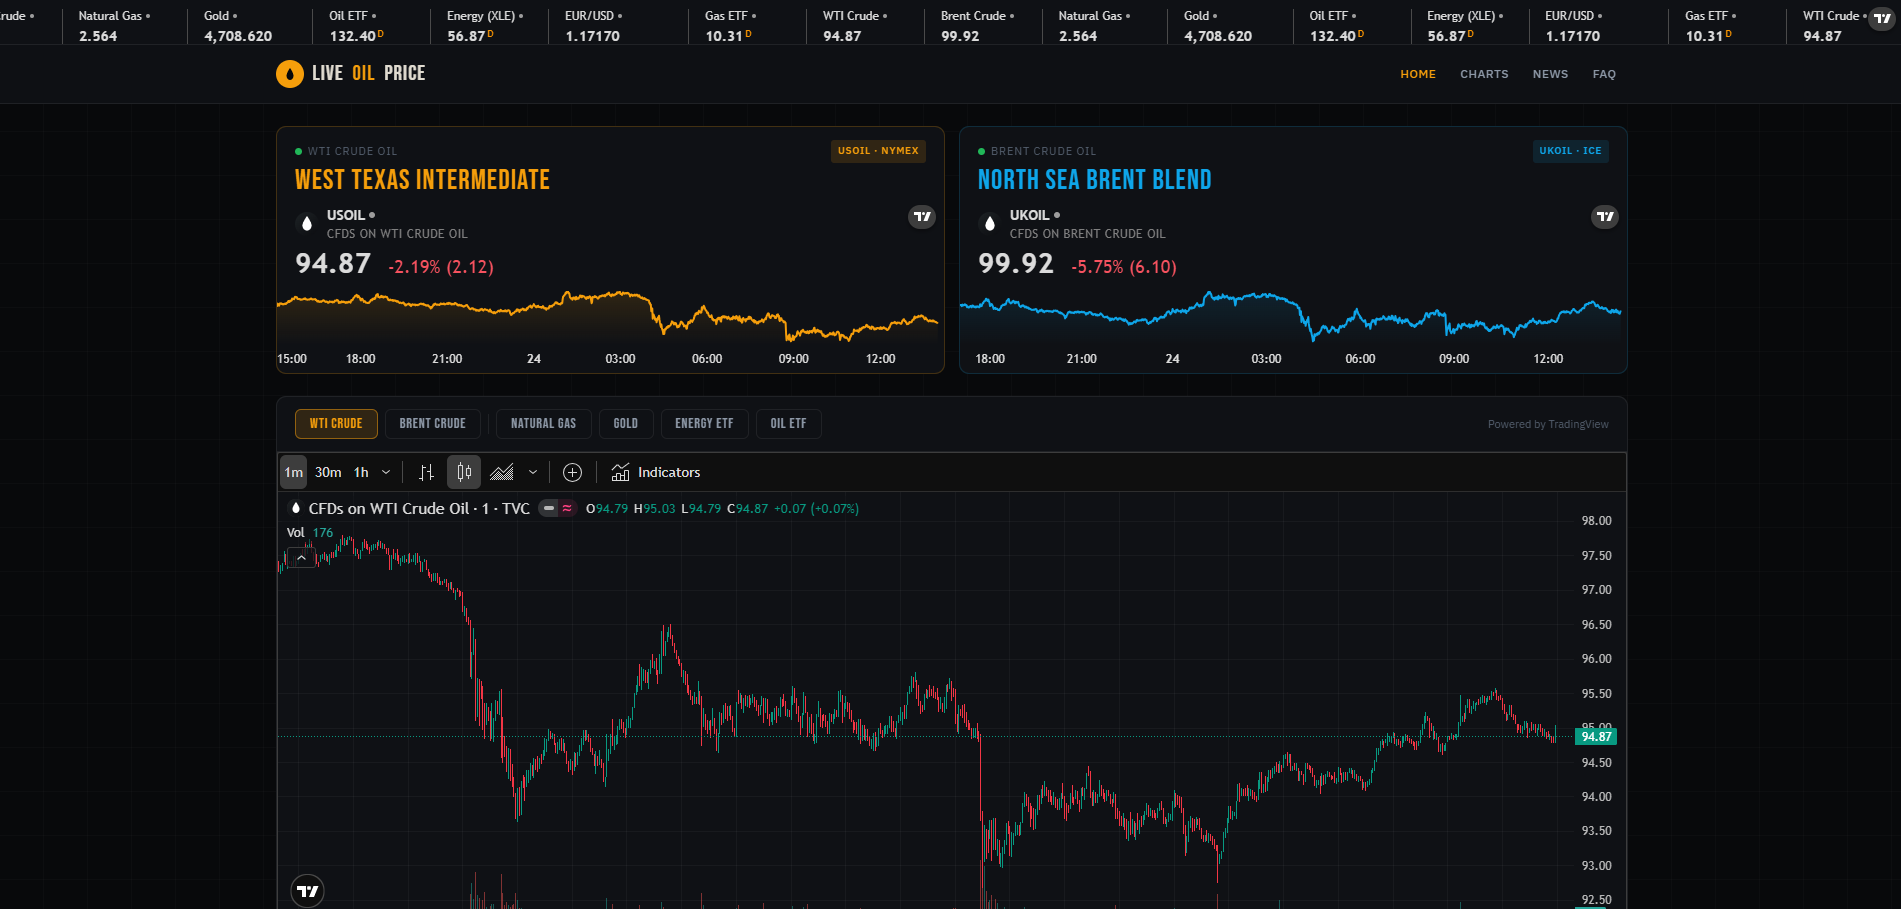
On Live Oil Price, one of our own sites, live WTI, Brent and natural gas charts sit at the top of the page. Below them come weekly EIA petroleum inventories, Baker Hughes rig counts, monthly crude production for producers across 32 countries, a daily market update and a FAQ that explains the terms. The site also offers a contact form and a newsletter signup.
- Project
- Website
- Sector
- Energy markets: oil and natural gas prices
- Scope
- One-page dashboard: charts, data, news, FAQ
- Highlights
- Live charts, EIA inventories, output for 32 countries
- Live site
- LiveOilPrice.com
The Brief
A price on its own tells half the story. On our own site we wanted the live quote and the supply data that explains it side by side, so nobody needs a second tab.
- Put live WTI, Brent and natural gas charts at the top, updated through the trading day.
- Show weekly US inventories and drilling activity as quick-read cards with the direction of change.
- Cover crude production by region and country, with each producer's history a tap away.
- Answer the basic questions, such as WTI versus Brent, for readers new to the oil market.
What We Designed
Live Oil Prices Today heads the page, with live quotes for WTI and Brent and TradingView charts covering crude, natural gas, gold, and energy and oil ETFs. Beneath them, US inventories and drilling appear as a set of cards, from commercial crude and the strategic reserve to Cushing stocks and refinery use, each showing its weekly change. International production follows, grouped by region.
We used Bebas Neue for headings, which gives the page the clipped authority of a trading screen, and IBM Plex Sans for everything meant to be read closely. Near-black backgrounds, warm grey text and an amber accent keep the page calm under a lot of data, while the up and down arrows do the signalling. The tone stays informational, with a clear disclaimer that nothing here is financial advice.
Live price charts
WTI, Brent and natural gas, plus gold and energy and oil ETFs, charted live through the trading day by TradingView.
Inventories and rigs
Weekly EIA petroleum stocks and Baker Hughes rig counts, with total, oil and gas rigs broken out.
Production by country
Monthly crude output for producers in 32 countries, grouped by region, with a tap on any card bringing up its history.
Oil market FAQ
Plain answers on WTI versus Brent, rig counts, inventories, update timing and why prices move so quickly.
How We Achieved It
We built the page around three tiers of data that each update on their own rhythm: live prices through the trading day, weekly inventories and rig counts, and monthly production. Each tier names its source on the page (TradingView for the charts, the EIA for inventories and production, Baker Hughes for rigs), so readers always know where a number comes from and how recent it is.
Tapping a production card brings up its history, which keeps a lot of detail close at hand without stretching the page. The navigation jumps between charts, news and the FAQ, a daily oil price update keeps the written content current, and both the contact form and the newsletter signup are protected against spam with Google reCAPTCHA.
Keep Exploring
More Case Studies


Want a Website Like This?
Let's talk about what your business needs, or start with a custom five-page website for $49 US a month.